

To prepare single-crystal cathodes, 3 μm-sized hydroxide precursor powders were uniformly mixed with LiOH and calcined at 850, 900, and 950 °C for 10 h to obtain S-NCM90, S-NCM80, and S-NCM70, respectively. To obtain polycrystalline P-NCM cathodes, 10 μm hydroxide precursor powders were uniformly mixed with LiOH and calcined at 750, 770, and 810 °C for 10 h, respectively, to obtain P-NCM90, P-NCM80, and P-NCM NCM70. Figure 1a shows that the particle size distribution of the P-NCM90 cathode is narrower with an average particle size of 9.71 μm (D50), while the particle size distribution of the S-NCM90 cathode is relatively wider with an average particle size of 3.08 μm (D50). XRD spectra show that they all have a hexagonal α-NaFeO2 type structure, belong to the R3̅m space group, and have no impurities. The morphology of S-NCM and P-NCM cathode particles shows that the S-NCM cathode particles are polygonal micron particles; each particle is composed of one or several single particles. In contrast, the P-NCM cathode particles consist of nanoscale particles that are closely packed to form nearly spherical secondary particles; these secondary particles show good monodispersity.
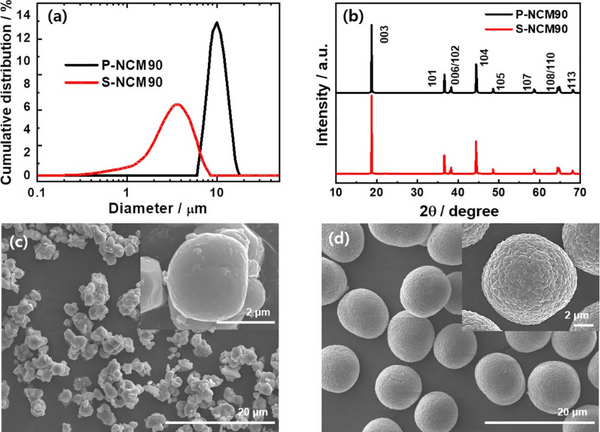
Figure 1. (a) Particle size distribution, (b) XRD, and (c) SEM images of S-NCM90 and (d) P-NCM90 cathodes for pristine S-NCM90 and P-NCM90 cathodes.
Figure 2a–c shows that the capacities of the two cathodes increase with increasing Ni content. Although the P-NCM and S-NCM cathodes achieved similar initial charge capacities, the discharge capacity of the S-NCM cathodes was lower than that of the P-NCM cathodes. Compared with P-NCM, the Coulombic efficiency (CE) of S-NCM cathode is lower. Figure 2d–f shows that the difference between the initial capacities of S-NCM and P-NCM cathodes increases with the increase of Ni content. The poor cycle performance of the S-NCM cathode is mainly attributed to its morphology; unlike the P-NCM cathode particles with a three-dimensional rapidly diffusing grain boundary network, Li ions in the S-NCM cathode particles mainly migrate through bulk diffusion, resulting in electrochemical slow response
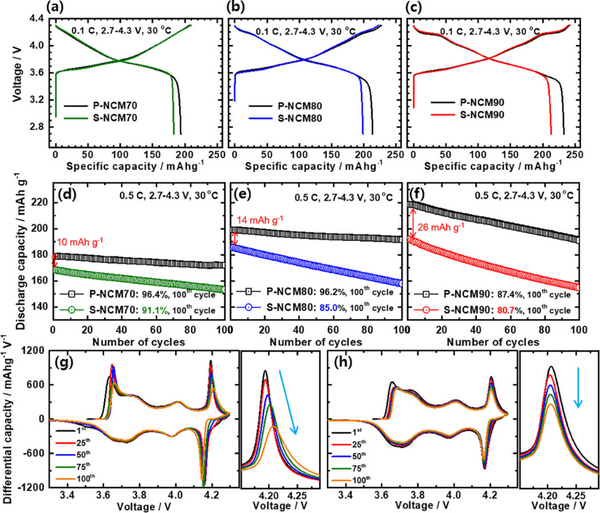
Figure 2. Electrochemical performance of S-NCM and P-NCM cathodes: (a–c) initial charge–discharge curves at 0.1 C and (d–f) cycle performance at 0.5 C. Differential capacity (dQ dV-1) curves and H2-H3 phase transition redox peaks of (g) P-NCM90 and (h) S-NCM90 cathode batteries.
Both the P-NCM70 and P-NCM80 cathodes had a capacity retention of more than 96% after 100 cycles, while the P-NCM90 cathode experienced a relatively significant capacity loss, retaining 87.4% of its initial capacity. The cycle stability of S-NCM cathode gradually deteriorated with the increase of Ni content; the capacity retention of S-NCM70, S-NCM80 and S-NCM90 cathodes after 100 cycles were 91.1%, 85.0% and 80.7%, respectively. In the deeply charged state, the H2–H3 phase transition in the Ni-rich layered cathode leads to anisotropic shrinkage/expansion of the lattice structure. The resulting structural stress undermines the mechanical stability of polycrystalline cathode particles, as the locally accumulated stress is released along the grain boundaries through microcrack nucleation. The severity of the anisotropic volume change increases with increasing Ni content; thus, cathodes with high Ni are more prone to microcracks, allowing the electrolyte to penetrate the cathode particles and damage their inner surfaces. Figure 2g shows that the H2-H3 peak intensity of the P-NCM90 cathode decreases with cycling and the polarization becomes larger, indicating that due to the severe volume change caused by the H2-H3 phase transition, a large number of microcracks are formed in the P-NCM90 cathode particles, The subsequent formation of surface impurities increases impedance and accelerates capacity fading. In contrast, the H2-H3 peak decay rate of the S-NCM90 cathode is not as fast as that of the P-NCM90 cathode, and although its cycle stability is poor, there is no position change during cycling, indicating that the S-NCM and P-NCM cathodes The capacity loss mechanism is different.
Regardless of the Ni content in the S-NCM cathode, the incidence of microcracks in the charged S-NCM cathode particles is low. Although most of the charged S-NCM70 and S-NCM80 cathode particles remained intact, some intragranular cracks were observed in some S-NCM90 cathode particles, and the enlarged images confirmed the presence of intragranular cracks. The intragranular cracking of S-NCM cathode particles is mainly due to the inhomogeneous structural stress caused by the difference in lithium concentration in the particles. Cracks nucleate within the single crystal by triggering the sliding of layer planes, thereby releasing local tensile/compressive and shear stresses. During discharge, the microcracks close as the structural stress disappears. After 100 cycles, although some cracks can be seen, most of the discharged S-NCM90 cathode particles are almost intact, maintaining their original shape despite repeated crack nucleation and closure. In contrast, intergranular cracks were observed in almost all charged P-NCM90 cathode particles. Microcracks propagate along the grain boundaries of secondary particles, separating adjacent primary particles. Repeated nucleation during long cycling degrades the mechanical stability of the P-NCM90 particles, resulting in microcracks that persist even in the fully discharged state of the secondary particles. The most critical difference between the intragranular and intergranular cracking behaviors of S-NCM90 and P-NCM90 cathode particles, respectively, is that the latter exposes the particle interior to the electrolyte, exacerbating side reactions.
As shown in Figure 3g, the exposed area of the P-NCM90 cathode increases gradually with the charge state up to 4.17 V, and then increases sharply between 4.17 and 4.3 V, which is caused by the H2–H3 phase transition. In contrast, although the surface area of the S-NCM90 cathode was initially higher than that of the P-NCM90 cathode, its surface area hardly changed upon charging to 4.5 V. The variation of the charge transfer resistance (Rct) of the positive electrodes of S-NCM and P-NCM is obviously different. The intergranular cracking of P-NCM90 cathode particles allows the electrolyte to infiltrate along the grain boundaries, and the resulting surface degradation leads to the accumulation of impurity layers. The increased Rct of the P-NCM90 cathode resulted in decreased H2-H3 peak intensity and increased polarization. In contrast, the Rct of the S-NCM90 cathode hardly changes during cycling.
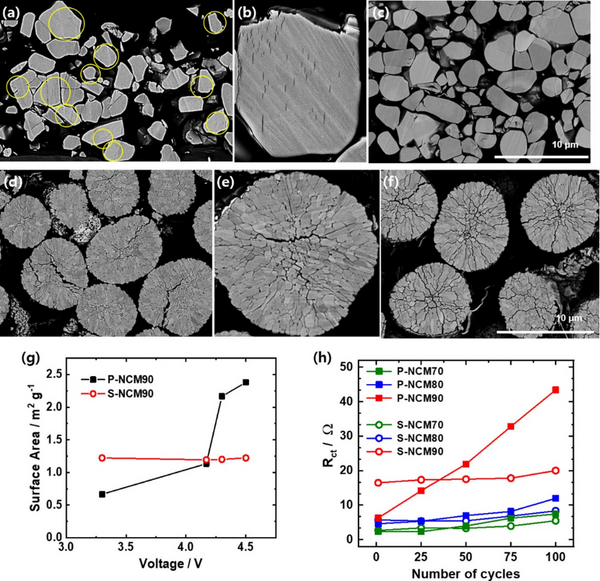
Figure 3. Cross-sectional SEM of (c) S-NCM90, (f) P-NCM90 positive electrode initially charged to 4.5 V (a, b) S-NCM90, (d, e) P-NCM90 positive electrode and discharged after 100 cycles. image. (g) Specific surface area of P-NCM90 and S-NCM90 cathodes as a function of state of charge. (h) Changes in the charge-transfer resistance (Rct) of the S-NCM and P-NCM cathodes during cycling.
Despite the low Rct of the single crystal cathode, it exhibits relatively poor cycling stability. The in situ XRD of Figure 4a and b shows two series of superimposed (003) peaks, revealing the phase evolution between 4.15 and 4.5 V for the P-NCM90 and S-NCM90 cathodes. The (003) peak of the P-NCM90 cathode shifted smoothly to a higher angle with limited changes in intensity and width. In contrast, the (003) peak intensity of the S-NCM90 cathode is significantly reduced, and the peak becomes asymmetric due to the presence of multiple phases at ~4.2 V, corresponding to the H2-H3 phase transition. Beyond 4.2 V, the (003) peak partially recovers its intensity and shape with increasing voltage until 4.5 V. Significant changes in strength and symmetry during phase transition imply inhomogeneous strain induced by structural deformation. The deconvoluted (003) peak of the P-NCM90 cathode in Figure 4c indicates the coexistence of two phases at 4.2 V. For the S-NCM90 cathode, two-phase coexistence was observed at 4.19 V and persisted even above 4.3 V, at which point the H2-H3 transition should be complete and only a single phase exists. The in situ XRD data of the S-NCM90 cathode indicated that the slow kinetics of the H2–H3 phase transition might generate an inhomogeneous Li distribution within the cathode. Structural deformations are more pronounced at high magnifications. Figure 4e–h shows that despite the high magnification, the (003) peak of the P-NCM90 cathode almost maintains a symmetrical shape above 4.14 V, indicating that the transition from H2 phase to H3 phase is quite fast. In contrast, for the S-NCM90 cathode, even at 4.5 V, the slow phase transition leads to the residual H2 phase. In addition, the H2 phase in the S-NCM90 cathode did not move during charging, so two clearly separated peaks were observed above 4.3 V. At 4.5 V, the two deconvoluted peaks are about 1° apart. The separation between the deconvoluted (003) peaks indicates the inhomogeneity of Li concentration and the consequent inhomogeneous strain in the S-NCM90 cathode. During charging at 0.5 C, the peak of the S-NCM70 cathode broadened and decreased in intensity between 4.15 and 4.5 V, and there was still a residual peak at 18.4°. The (003) peak of S-NCM80 cathode is much broader at 0.5 C than at 0.2 C. These results suggest that single-crystal cathodes experience more severe structural inhomogeneity at high rates, which may be attributed to their long diffusion paths, and that as the Ni fraction approaches 90%, the structural inhomogeneity leads to increasing local internal strain. more serious.
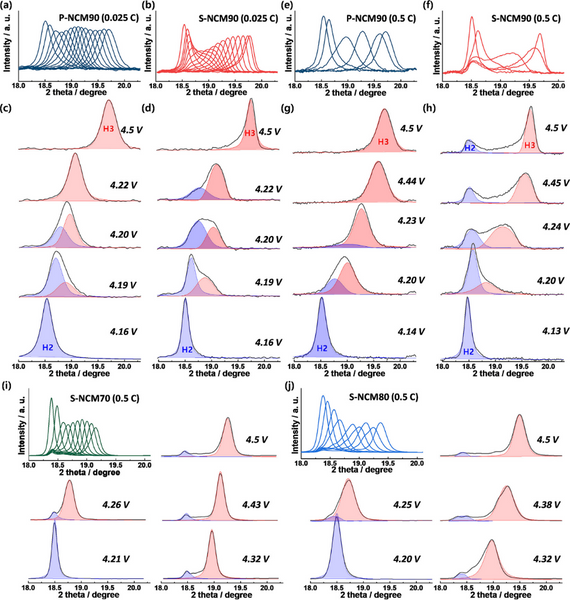
Figure 4. Overlap and deconvolution of (003) peak in in situ XRD in the voltage range of 4.15–4.5 V: (a,c) P-NCM90 at 0.025 C and (e,g) 0.5 C, (b,d) ) S-NCM90 at 0.025 C and (f,h) 0.5 C, (i) S-NCM70 at 0.5 C, and (j) S-NCM80 at 0.5 C.
According to the corresponding [100] zone-axis electron diffraction pattern, high-resolution TEM images were obtained in the region between the surface (i) and center (ii) of the charged S-NCM90 cathode, which is aligned with the Li-ion diffusion path direction. Figure 5c shows that the calculated c-axis lattice parameters increase from the particle surface towards the center. TEM results reveal that the charged S-NCM90 cathode particles are composed of domains with different lattice parameters, which have different lithium ion concentration gradient distributions. The inhomogeneity within the positive electrode particles generates non-uniform steric stress, which is released by the generation of structural defects through crystal plane sliding and particle breakage during electrochemical reactions. Repeated cycling exacerbates the spatial inhomogeneity of Li ion concentration and strain in the Ni-rich S-NCM cathode and leads to capacity fading of the S-NCM cathode.
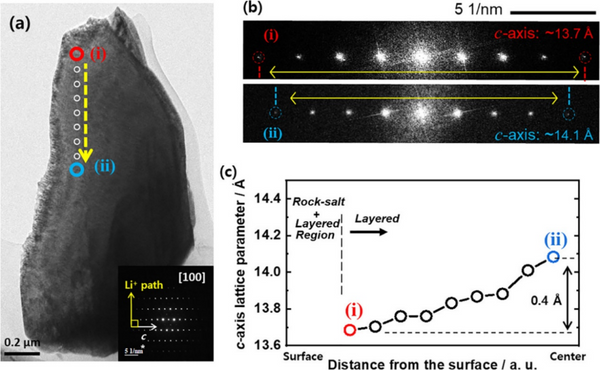
Figure 5, (a) TEM image of S-NCM90 cathode particles charged to 4.3 V at 0.5 C and (b) partial electron diffraction patterns from (i) and (ii) regions. (c) The c-axis lattice parameter at the position of the yellow dashed line in (a).
【in conclusion】
Unlike the P-NCM cathode, which is susceptible to intergranular microcracks, the S-NCM cathode is resistant to mechanical fracture even in a deeply charged state or repeated cycling. However, the electrochemical performance of the S-NCM cathode is inferior to that of the P-NCM cathode in terms of capacity and cycle stability due to the limited lithium ion diffusion path. The difference in electrochemical performance of S-NCM and P-NCM cathodes increases with the increase of Ni content. The rapid capacity fading of the P-NCM cathode is mainly attributed to the formation of microcracks, electrolyte erosion, and the accumulation of NiO-like rock-salt phases. In contrast, due to the limited Li-ion diffusion paths in the S-NCM cathode, the distribution of Li tends to become spatially inhomogeneous during cycling, a tendency exacerbated by high rates and high Ni, leading to the coexistence of two phases. In situ XRD and TEM observations show that the structural inhomogeneity of the charged S-NCM90 cathode induces inhomogeneous stress, which leads to structural defects that limit the Li+ diffusion kinetics and ultimately lead to capacity fading.