

Computed tomography (CT) technology is mainly used in the medical field to detect the internal health status of the human body. With the development of related technologies, especially the resolution of radiation sources and detection devices, micron-scale X-ray computed tomography technology is gradually applied in the fields of geological exploration, bionics and materials science.
By comprehensively scanning the internal structure of the test sample, tomographic images with different contrasts are formed according to the density difference of the internal structure, so as to accurately grasp the number, volume fraction and distribution of pores, inclusions, cracks and the three-dimensional space of the material microstructure inside the sample It is helpful to analyze the relationship between defect information and mechanical properties of materials, identify the role of defects in material failure, and then help to study the failure mechanism to optimize and improve the material preparation process.
This paper analyzes the internal structure characteristics of lithium-ion power battery cells through computer tomography technology, aiming at the battery life and safety issues that are closely concerned by the current lithium-ion power battery industry. In terms of battery aging degree, the evolution of the overall internal structure of the battery after different cycles is compared in detail; in terms of battery safety hazards, problems such as electrode fracture, electrode folds, pole piece alignment and internal foreign matter are analyzed in the computed tomography images. The characteristics of the battery were analyzed, and the internal structure of the battery after the safety test was analyzed.
1. Test methods and technical parameters
1.1 Test method
Figure 1 is an X-ray computed tomography test photograph. The left side is the X-ray source, the middle is the test sample stage, and the right side is the detector. These three key components are located inside the shielded lead room to ensure that the test personnel will not be affected by X-ray radiation during the test.

FIG. 2 is a schematic diagram of the principle of the scanning device. As shown in Figure 2(a), X-rays are emitted from the radiation source, and after penetrating the test sample, the transmitted X-rays are received by the imaging unit in the detector, converted into digital signals, and displayed in the computer. The computed tomography images obtained from the 18650-type lithium-ion battery are shown in Fig. 2(b) and Fig. 2(c). Figure 2(b) is an example of a cross-sectional image of the battery, from which the winding structure inside the battery can be clearly observed. Figure 2(c) is an example of a longitudinal cross-sectional image of the battery, from which the overall regularity of the battery structure can be observed.
1.2 Technical parameters
The X-ray tomography analysis performed in this paper was performed using a nanoVoxel-4000 computed tomography system from Tianjin Sanying Precision Instrument Co., Ltd. During the test, the X-ray source voltage was set to 225kV, the resolution was 2μm; the imaging area of the X-ray detector was 244mm×196mm, and the imaging range was 300mm×450mm (diameter×height). The experimental conditions of X-ray computed tomography test are shown in Table 1.
The X-ray tomography analysis performed in this paper was performed using a nanoVoxel-4000 computed tomography system from Tianjin Sanying Precision Instrument Co., Ltd. During the test, the X-ray source voltage was set to 225kV, the resolution was 2μm; the imaging area of the X-ray detector was 244mm×196mm, and the imaging range was 300mm×450mm (diameter×height). The experimental conditions of X-ray computed tomography test are shown in Table 1.
II. RESULTS AND DISCUSSION
2.1 Non-destructive testing of power battery cell aging degree
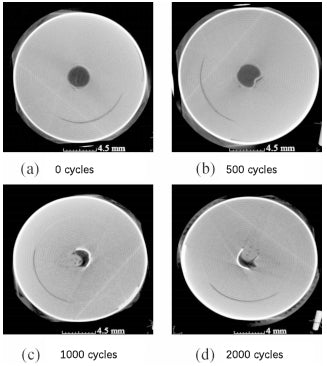
In order to explore the evolution of the internal structure of the power battery after long-term cycling, the 1# sample was charged and discharged at a rate of 2C, and the test was suspended after a certain number of cycles, and the battery was discharged to empty electricity. , analyze the changes in its internal structure. Figure 3 is a computed tomography longitudinal section image of the test sample. Figures 3(a)–(d) correspond to new batteries with cycles of 500, 1000, and 2000 cycles, respectively. The internal structure of the battery that has not been cycled is very regular (Fig. 3(a)), and a layered wound electrode and a void in the center of the battery can be observed. When the cycle was up to 500 cycles (Fig. 3(b)), it could be observed that the internal electrode had obvious bulges, and the bulges were mainly concentrated at the bottom of the battery. When the cycle reached 1000 cycles, bulges appeared on the bottom and upper ends of one electrode. When the cycle reached 2000 cycles, the bulges on one side were connected together, forming larger bulges and smaller bulges on the other side of the electrode. rise.
2.1 Non-destructive testing of power battery cell aging degree
In order to explore the evolution of the internal structure of the power battery after long-term cycling, the 1# sample was charged and discharged at a rate of 2C, and the test was suspended after a certain number of cycles, and the battery was discharged to empty electricity. , analyze the changes in its internal structure. Figure 3 is a computed tomography longitudinal section image of the test sample. Figures 3(a)–(d) correspond to new batteries with cycles of 500, 1000, and 2000 cycles, respectively. The internal structure of the battery that has not been cycled is very regular (Fig. 3(a)), and a layered wound electrode and a void in the center of the battery can be observed. When the cycle was up to 500 cycles (Fig. 3(b)), it could be observed that the internal electrode had obvious bulges, and the bulges were mainly concentrated at the bottom of the battery. When the cycle reached 1000 cycles, bulges appeared on the bottom and upper ends of one electrode. When the cycle reached 2000 cycles, the bulges on one side were connected together, forming larger bulges and smaller bulges on the other side of the electrode. rise.
Figure 4 is a computed tomography cross-sectional image of a test sample. Figures 4(a)–(d) correspond to new batteries and batteries with cycle cycles of 500, 1000, and 2000 cycles, respectively. In the cross-sectional view of the battery sample, the winding structure of the electrode inside the battery can be better observed, and the internal deformation of the battery during cycling can also be reflected by the change of the central void of the battery. As shown in Fig. 4(a), the gap in the center of the battery is a regular circle, and as the cycle progresses, the circle gradually sags, occupying more than 2/3 of the area of the center of the battery after 2000 cycles. As the cycle progresses, the internal structure of the sample undergoes significant deformation. The large deformation inside the electrode will lead to the separation of the positive and negative electrodes of the battery, the effective electrochemical reaction area will be reduced, the capacity will decay, and there will be a hidden danger of internal short circuit.
2.2 Non-destructive testing of potential safety hazards of power battery cells
2,2.1 Structural fracture
The power battery will break the electrode structure due to factory defects or the charging and discharging process. The fracture of the electrode generally occurs at the bending point of the internal electrode of the battery, such as the inner side of the coiled cell of a cylindrical battery, and the inner side of the coiled and stacked electrodes of a soft pack and square case battery. Figure 5 is a CT scan image of the internal electrodes of a rectangular hard case battery. A clear layered structure of positive and negative electrodes can be observed from Figure 5(a) and (b), the layer with high contrast corresponds to the positive pole piece, and the layer with low contrast corresponds to the negative pole piece.
Fig. 5(b) is an enlarged CT image of the part with structural fracture at another part of the electrode. As indicated by the arrow in the figure, in the inner 4 layers of the curved part of the electrode, a darker point can be observed, indicating that the electrode density at this point is lower than that of the surrounding area, that is, the electrode structure is fractured, and the fracture distance is about 0.13mm. . The fracture of the electrode will make the electrical connection degree of the microstructure near the fracture point different from that of other areas, which will lead to uneven current density distribution during the charging and discharging process, resulting in a small amount of uneven heat generation and capacity loss. Since the electrode will deform during cycling, the fracture degree of the electrode may be enlarged due to the overall deformation of the electrode. This hypothesis needs further comparison and verification to prove.
2.2.2 Electrode pleats
In the power battery, whether the electrodes are wrinkled can represent the overall regularity of the internal structure of the battery, which is related to the degree of ex-factory of the battery and the degree of use of the battery. Figure 6(a) and Figure 6(b) are the results of CT scanning on two square hard-shell batteries of the same type. It can be observed that in Fig. 6(a), each layer of the electrode in the flat and curved area shows high consistency, and the void in the center of the battery winding also presents a straight line with a high degree of regularity; from Fig. 6( b) It can be clearly observed that some electrodes are wrinkled, and the electrodes are bent as a whole.
Figure 6(c) is a detailed image of the area with the largest wrinkle degree. The maximum wrinkle length is about 10mm, and the wrinkle arc is about 150°, as shown in the circle in Fig. 6(c), the appearance of the wrinkle leads to a gap between the positive and negative electrodes inside the electrode, which reduces the effectiveness of the positive and negative electrodes of the battery. The contact area will affect the reactivity of the electrode during use and increase the risk of internal short circuits in the battery. The internal voids of the battery due to wrinkles also affect the capacity and internal resistance of the battery, which in turn affects its heat generation, increasing the consistency of the battery modules or cells in the system.
2.2.3 Pole piece alignment
The difference in the alignment of the pole pieces of the battery is mainly caused by the process level of the battery when it leaves the factory. Poorly aligned pole pieces can lead to asymmetry between the positive and negative electrodes, which not only results in partial capacity loss, but also increases the risk of internal short circuits in the battery. For example, when scanning multiple square shell batteries of the same model, the electrode areas with different alignments are shown in Figure 7.
The regions with higher contrast in the figure are positive, and the regions with lower contrast are negative. As shown by the red line in the figure, the relative length of each positive pole piece and the reference electrode is calculated based on the electrodes with the same length in the two scanning areas, as shown in Figure 7(c). The standard deviation of the relative length of the positive electrode piece in Fig. 7(a) is 294.38 μm, and the average length difference of the positive electrode piece in Fig. 7(b) is 810.01 μm. The results show that the alignment of the positive pole pieces in Fig. 7(b) is significantly worse than that in Fig. 7(a). The difference in the alignment of the pole pieces will not only lead to the reduction of the capacity of the electrode terminal due to the reduction of the contact surface of the positive and negative electrodes, but also the possibility of internal short circuit caused by the extra protruding positive and negative electrodes. When the battery is vibrated, collided, or dropped, the battery with poor alignment is more likely to cause an internal short circuit due to the direct contact of the positive and negative electrodes, and a large amount of heat is released.
2.2.4 Foreign objects in the battery
The foreign matter inside the battery is mainly caused by the process defects of the battery when it leaves the factory. Since CT scanning technology is sensitive to high-density materials, it is mainly metal foreign objects that can be detected. As shown in Figure 8, the metal foreign matter detected in Figure 8(a) is a metal foreign matter in the electrode. A high-contrast spot with a particle size of about 100 μm × 200 μm can be observed in the electrode, which is located between the two layers of electrodes in the battery. As shown by the arrow in the figure. The foreign matter in the electrode is likely to cause the temperature of the micro area to be too high during the use of the battery, resulting in a safety hazard. Figure 8(b) is an image of foreign matter in the battery sealing ring, and the particle size of the foreign matter is about 100 μm. Foreign matter in the sealing ring may cause the battery to be loosely sealed and cause the hidden danger of electrolyte leakage during use.
2.3 Internal structure analysis of power battery cells after safety test
2.3.1 Electrical safety test
Figure 9 shows the CT images of a certain 18650 battery before and after the overdischarge test. Figure 9(a) is the cross-sectional and longitudinal cross-sectional images of an empty battery that has not been over-discharged. It can be observed that the inside of the battery presents a regular winding structure of positive and negative electrodes. Figure 9(b) shows the battery after 1C overdischarge to 150% DOD, and after 1 charge-discharge to empty. From the CT image, it can be observed that the overall winding structure of the battery remains relatively intact, but small burrs can be seen, which is caused by the copper dissolution of the positive electrode during the overdischarge process of the battery. In addition, by measuring the thickness of the positive and negative electrodes, it was found that after the discharge, the thickness of the positive electrode increased from 102.7 μm to 182.1 μm, and the thickness of the negative electrode increased from 175.2 μm to 198.6 μm, indicating that the electrode thickened during the overdischarge process.
Figure 10(a) is the CT image of a certain 18650 battery after acupuncture test. It can be clearly observed that acupuncture has a serious impact on the internal structure of the battery, the puncture hole is clearly visible, and the overall internal structure of the battery is cloudy, which is caused by the thermal runaway of the battery during the acupuncture process, resulting in high temperature and combustion. Figure 10(b) is a cross-sectional image of the battery after acupuncture. It can be seen that the force generated by the acupuncture through the battery has deformed the overall structure of the battery.